

Code optimization tools enhance software performance by identifying and rectifying inefficient code. They help developers create faster, more efficient applications.
Code optimization tools are essential for developers aiming to boost application performance. These tools analyze code to detect inefficiencies, bottlenecks, and potential errors. By using them, developers can streamline code, enhance execution speed, and reduce resource consumption. Popular tools like Visual Studio Profiler, JProfiler, and ReSharper offer various features to aid in this process.
They provide insights into memory usage, CPU performance, and more. Optimizing code not only improves application speed but also enhances user experience. Effective use of these tools leads to robust, high-performing software. Investing in code optimization tools is crucial for delivering top-quality applications in today’s competitive market.
Introduction To Code Optimization
Code optimization is a crucial aspect of software development. It ensures that programs run efficiently and effectively. By refining your code, you can improve performance and reduce resource consumption. Let’s dive into the world of code optimization and understand its importance.
Why It Matters
Optimized code provides numerous benefits. It enhances performance, ensuring faster execution. This is vital for user satisfaction. Efficient code also reduces the load on servers, saving costs. Optimized code is easier to maintain and debug. This leads to fewer errors and smoother updates. Moreover, it improves the overall quality of the software, making it more reliable.
Common Bottlenecks
Identifying bottlenecks is essential for effective code optimization. Let’s look at some common issues:
- Memory Leaks: Unreleased memory causing slowdowns.
- Redundant Code: Repeated code that wastes resources.
- Unoptimized Loops: Inefficient loops can hinder performance.
- Database Queries: Inefficient queries can slow down applications.
Addressing these bottlenecks can significantly improve performance. Use profiling tools to identify and fix these issues. Regular code reviews can also help in spotting inefficiencies early.
| Tool | Function |
|---|---|
| Valgrind | Detects memory leaks |
| GDB | Debugging and performance analysis |
| VisualVM | Java application profiling |
Static Analysis Tools
Code optimization is essential for high-performing software. Static analysis tools play a crucial role in this process. These tools analyze your code without executing it, identifying potential issues and inefficiencies. They help improve code quality, maintainability, and performance.
Benefits Of Static Analysis
Static analysis tools offer numerous benefits for developers and teams:
- Early bug detection: Identify issues before runtime.
- Code quality: Enforce coding standards automatically.
- Security: Detect vulnerabilities in the code.
- Maintainability: Improve code readability and structure.
- Cost-effective: Reduce debugging and maintenance costs.
Top Static Analysis Tools
Several tools can help with static code analysis. Here are some top options:
| Tool | Features | Supported Languages |
|---|---|---|
| SonarQube | Code quality and security | Java, C#, JavaScript, PHP, and more |
| ESLint | JavaScript linting | JavaScript, TypeScript |
| Coverity | Static analysis and SAST | C, C++, Java, Python, and more |
| PyLint | Python code analysis | Python |
| Checkmarx | Security-focused analysis | Java, C#, JavaScript, and more |
Using the right static analysis tool enhances code quality. Developers can ensure their software is both efficient and secure.
Profiling Tools
Profiling tools help developers understand their code’s performance. These tools identify bottlenecks, memory leaks, and inefficient code paths. Profiling tools are essential for optimizing applications and ensuring they run smoothly.
How Profiling Works
Profiling tools monitor the code during execution. They collect data on resource usage, such as CPU and memory. This data helps pinpoint areas that need optimization.
Profiling can be done in various ways:
- Instrumentation: Involves adding extra code to monitor performance.
- Sampling: Periodically checks the state of the application.
- Event-based: Tracks specific events like function calls.
Different profiling tools use different methods. The choice depends on the specific needs of the application.
Popular Profiling Tools
There are several profiling tools available. Each tool has unique features and benefits.
| Tool | Description | Platform |
|---|---|---|
| gprof | A GNU profiler that uses instrumentation. | Linux |
| VisualVM | A visual tool for monitoring Java applications. | Java |
| Xcode Instruments | Analyzes iOS and macOS applications. | iOS, macOS |
| dotTrace | Profiles .NET applications with ease. | .NET |
Choosing the right tool depends on the programming language and platform. It is also important to consider the tool’s ease of use and the depth of insights it provides.
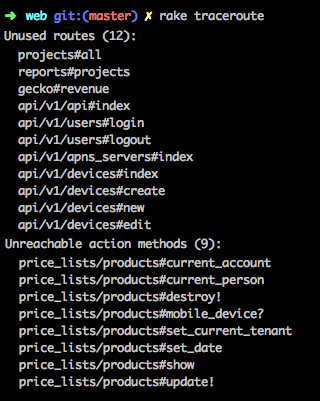
Credit: infinum.com
Memory Management Tools
Memory management is a crucial part of code optimization. Efficient memory usage ensures your programs run smoothly and without crashes. Memory management tools help developers monitor, allocate, and optimize memory usage in their applications. These tools are essential for improving performance and reducing errors.
Reducing Memory Leaks
Memory leaks occur when a program does not release unused memory. This can cause the application to consume more resources over time, leading to slow performance or crashes. Reducing memory leaks is vital for maintaining the health of your application.
Here are some strategies to reduce memory leaks:
- Regularly check your code for unused objects.
- Use automated tools to detect memory leaks.
- Adopt proper memory allocation and deallocation practices.
- Utilize garbage collection mechanisms where available.
Following these steps ensures efficient memory usage in your applications.
Best Memory Management Tools
Several tools are available to help with memory management. These tools provide insights and automate the detection of memory issues.
| Tool | Description |
|---|---|
| Valgrind | Valgrind is a powerful tool for detecting memory leaks and profiling. |
| GDB | GDB helps debug memory issues and provides detailed reports. |
| VisualVM | VisualVM monitors and troubleshoots memory problems in Java applications. |
| Memory Profiler | Memory Profiler, part of Android Studio, is great for Android apps. |
These tools are essential for keeping your application’s memory usage in check.
Code Minification Tools
Code Minification Tools reduce the size of your code. They remove unnecessary characters. This makes your website load faster. It improves user experience and SEO rankings.
Advantages Of Minification
Minification offers many benefits for your website.
- Faster Load Times: Smaller files load quicker.
- Reduced Bandwidth Usage: Less data transfer reduces costs.
- Improved SEO: Faster sites rank better on search engines.
- Enhanced User Experience: Quick sites keep users happy.
Leading Minification Tools
Many tools can help you minify your code. Here are the top ones:
| Tool Name | Features | Website |
|---|---|---|
| UglifyJS | Supports JavaScript, CLI support, source maps | UglifyJS GitHub |
| CSSNano | Minifies CSS, PostCSS plugin, flexible options | CSSNano |
| HTMLMinifier | Minifies HTML, handles whitespace, removes comments | HTMLMinifier NPM |

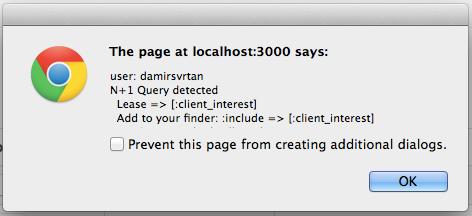
Credit: arunangshudas.medium.com
Automated Refactoring Tools
Automated refactoring tools can significantly improve your codebase. They help in making code cleaner and more efficient. These tools streamline the process of making code changes. They also ensure that the changes do not break the functionality. Let’s explore why automating refactoring is crucial and which tools are most effective.
Why Automate Refactoring?
Automating refactoring saves time and reduces errors. Manual refactoring is tedious and prone to mistakes. Automated tools ensure consistency across the codebase. They identify areas needing improvement faster than a human can. This leads to cleaner, more maintainable code.
These tools also help improve code readability. They follow best practices and coding standards. This makes it easier for new developers to understand the code. Automated refactoring also reduces technical debt. It keeps the codebase up-to-date with the latest coding standards.
Effective Refactoring Tools
| Tool Name | Features | Platform |
|---|---|---|
| Refactor.io | Supports multiple languages, real-time collaboration | Web-based |
| IntelliJ IDEA | Code analysis, refactoring suggestions | Windows, macOS, Linux |
| PyCharm | Python-specific refactoring, code inspection | Windows, macOS, Linux |
| ReSharper | Code quality analysis, refactoring support | Windows |
Refactor.io is a web-based tool that supports multiple languages. It allows real-time collaboration, making it easier to work in teams.
IntelliJ IDEA offers robust code analysis and refactoring suggestions. It is available on Windows, macOS, and Linux.
PyCharm is tailored for Python. It provides Python-specific refactoring and code inspection. It is compatible with Windows, macOS, and Linux.
ReSharper is a powerful tool for Windows users. It offers code quality analysis and extensive refactoring support.
Using these tools can make the codebase more efficient and easier to maintain. They ensure that best practices are followed consistently.
Performance Monitoring Tools
Performance monitoring tools help you track your application’s efficiency. They identify performance bottlenecks and ensure your code runs smoothly. These tools are essential for maintaining high-quality software.
Real-time Monitoring
Real-time monitoring tracks your application as it runs. It provides immediate insights into performance issues. This allows you to act quickly and resolve problems before they escalate.
Real-time monitoring tools can analyze various metrics. They look at memory usage, CPU load, and network traffic. This helps you maintain optimal performance.
Top Performance Monitoring Tools
Several tools excel at performance monitoring. Here are some of the best options:
| Tool | Features | Platform |
|---|---|---|
| New Relic | Real-time monitoring, error tracking, custom dashboards | Web, Mobile |
| AppDynamics | Full-stack visibility, application mapping, anomaly detection | Web, Mobile |
| Dynatrace | AI-powered insights, auto-discovery, root cause analysis | Web, Mobile |
Each tool offers unique features. Choose one that fits your project needs.
Credit: www.janbask.com
Integrating Optimization Tools
Integrating code optimization tools helps improve your code’s efficiency. These tools detect and fix issues early. They ensure your code runs faster and smoother.
Choosing The Right Tools
Choosing the right code optimization tools is crucial. It depends on your project needs. Consider the following factors:
- Compatibility: Ensure the tool works with your programming language.
- Ease of Use: The tool should be easy to integrate.
- Community Support: Look for tools with a strong user community.
- Documentation: Good documentation is essential for quick setup.
Here’s a table showcasing popular optimization tools:
| Tool Name | Language | Key Features |
|---|---|---|
| ESLint | JavaScript | Identifies and fixes code errors |
| PyLint | Python | Checks for errors and enforces coding standards |
| JSLint | JavaScript | Enforces coding conventions |
Best Practices For Integration
Integrating optimization tools should be seamless. Follow these best practices:
- Start Early: Integrate tools at the beginning of your project.
- Automate: Use continuous integration to automate checks.
- Regular Updates: Keep your tools updated for best performance.
- Team Training: Train your team on using these tools effectively.
Here’s a sample code snippet for integrating ESLint in a JavaScript project:
// Install ESLint
npm install eslint --save-dev

// Initialize ESLint
npx eslint --init

// Run ESLint
npx eslint yourfile.js
Case Studies
Code optimization is crucial for improving performance and efficiency. Real-world examples show the power of optimization tools. In this section, we’ll share successful stories and lessons learned.
Successful Optimization Stories
Many companies have achieved amazing results with code optimization tools. Let’s look at a few success stories.
| Company | Tool Used | Outcome |
|---|---|---|
| Company A | Tool X | 50% faster load times |
| Company B | Tool Y | 30% reduction in server costs |
| Company C | Tool Z | 40% increase in user engagement |
Company A used Tool X to optimize their JavaScript. This resulted in 50% faster load times. User experience improved significantly.
Company B implemented Tool Y. This reduced their server costs by 30%. The tool streamlined their backend processes.
Company C leveraged Tool Z. This enhanced their website’s performance. User engagement went up by 40%.
Lessons Learned
These case studies offer valuable lessons. Here are some key takeaways:
- Choose the right tool: Not all tools are equal. Select one that fits your needs.
- Monitor results: Track performance metrics. Ensure the tool is working effectively.
- Continuous improvement: Optimization is an ongoing process. Regularly update and refine your code.
Code optimization tools bring significant benefits. These stories highlight their importance. Choose wisely and monitor your results.
Future Of Code Optimization
The future of code optimization is exciting and transformative. New tools and technologies are emerging to make code faster and more efficient. Developers will have more resources to write better code.
Emerging Trends
Artificial Intelligence (AI) is revolutionizing code optimization. AI-driven tools can identify inefficiencies in code. They suggest fixes in real-time, making the development process smoother.
Machine Learning (ML) plays a big role too. ML algorithms learn from past coding mistakes. They help in predicting and preventing future errors.
Another trend is the rise of cloud-based optimization tools. These tools offer scalability and flexibility. Developers can access powerful optimization features from anywhere.
Innovations On The Horizon
Upcoming innovations promise to push the boundaries of code optimization. One such innovation is the use of Quantum Computing. Quantum computers can process complex algorithms faster. They can optimize code in ways traditional computers cannot.
Another innovation is the development of automated refactoring tools. These tools can rewrite code to improve its structure. They make code easier to read and maintain.
Lastly, integrated development environments (IDEs) are becoming smarter. Future IDEs will have built-in optimization features. They will assist developers throughout the coding process.
| Trend | Benefit |
|---|---|
| AI-driven Tools | Real-time code fixes |
| ML Algorithms | Predict and prevent errors |
| Cloud-based Tools | Scalability and flexibility |
Stay updated with the latest trends and innovations. The future of code optimization holds great potential.
Frequently Asked Questions
What Are Code Optimization Tools?
Code optimization tools help developers improve their code’s efficiency. They analyze code, identify bottlenecks, and suggest improvements.
Why Use Code Optimization Tools?
Using code optimization tools enhances performance, reduces resource usage, and improves user experience. It also helps in maintaining cleaner code.
Which Code Optimization Tools Are Popular?
Popular code optimization tools include Visual Studio Profiler, ReSharper, and SonarQube. Each offers unique features for different needs.
How Do Code Optimization Tools Work?
Code optimization tools analyze code for inefficiencies. They provide suggestions or automated fixes to improve performance and readability.
Conclusion
Optimizing code is crucial for performance and efficiency. Use the right tools to streamline your development process. Enhanced code leads to faster applications and better user experiences. Start integrating these tools into your workflow today. This will ensure your projects remain competitive and high-performing in the ever-evolving tech landscape.


